End-User Walkthrough of NuraLogix Web Measurement Service (WMS)
A user goes through the following steps to obtain measurements using the WMS.
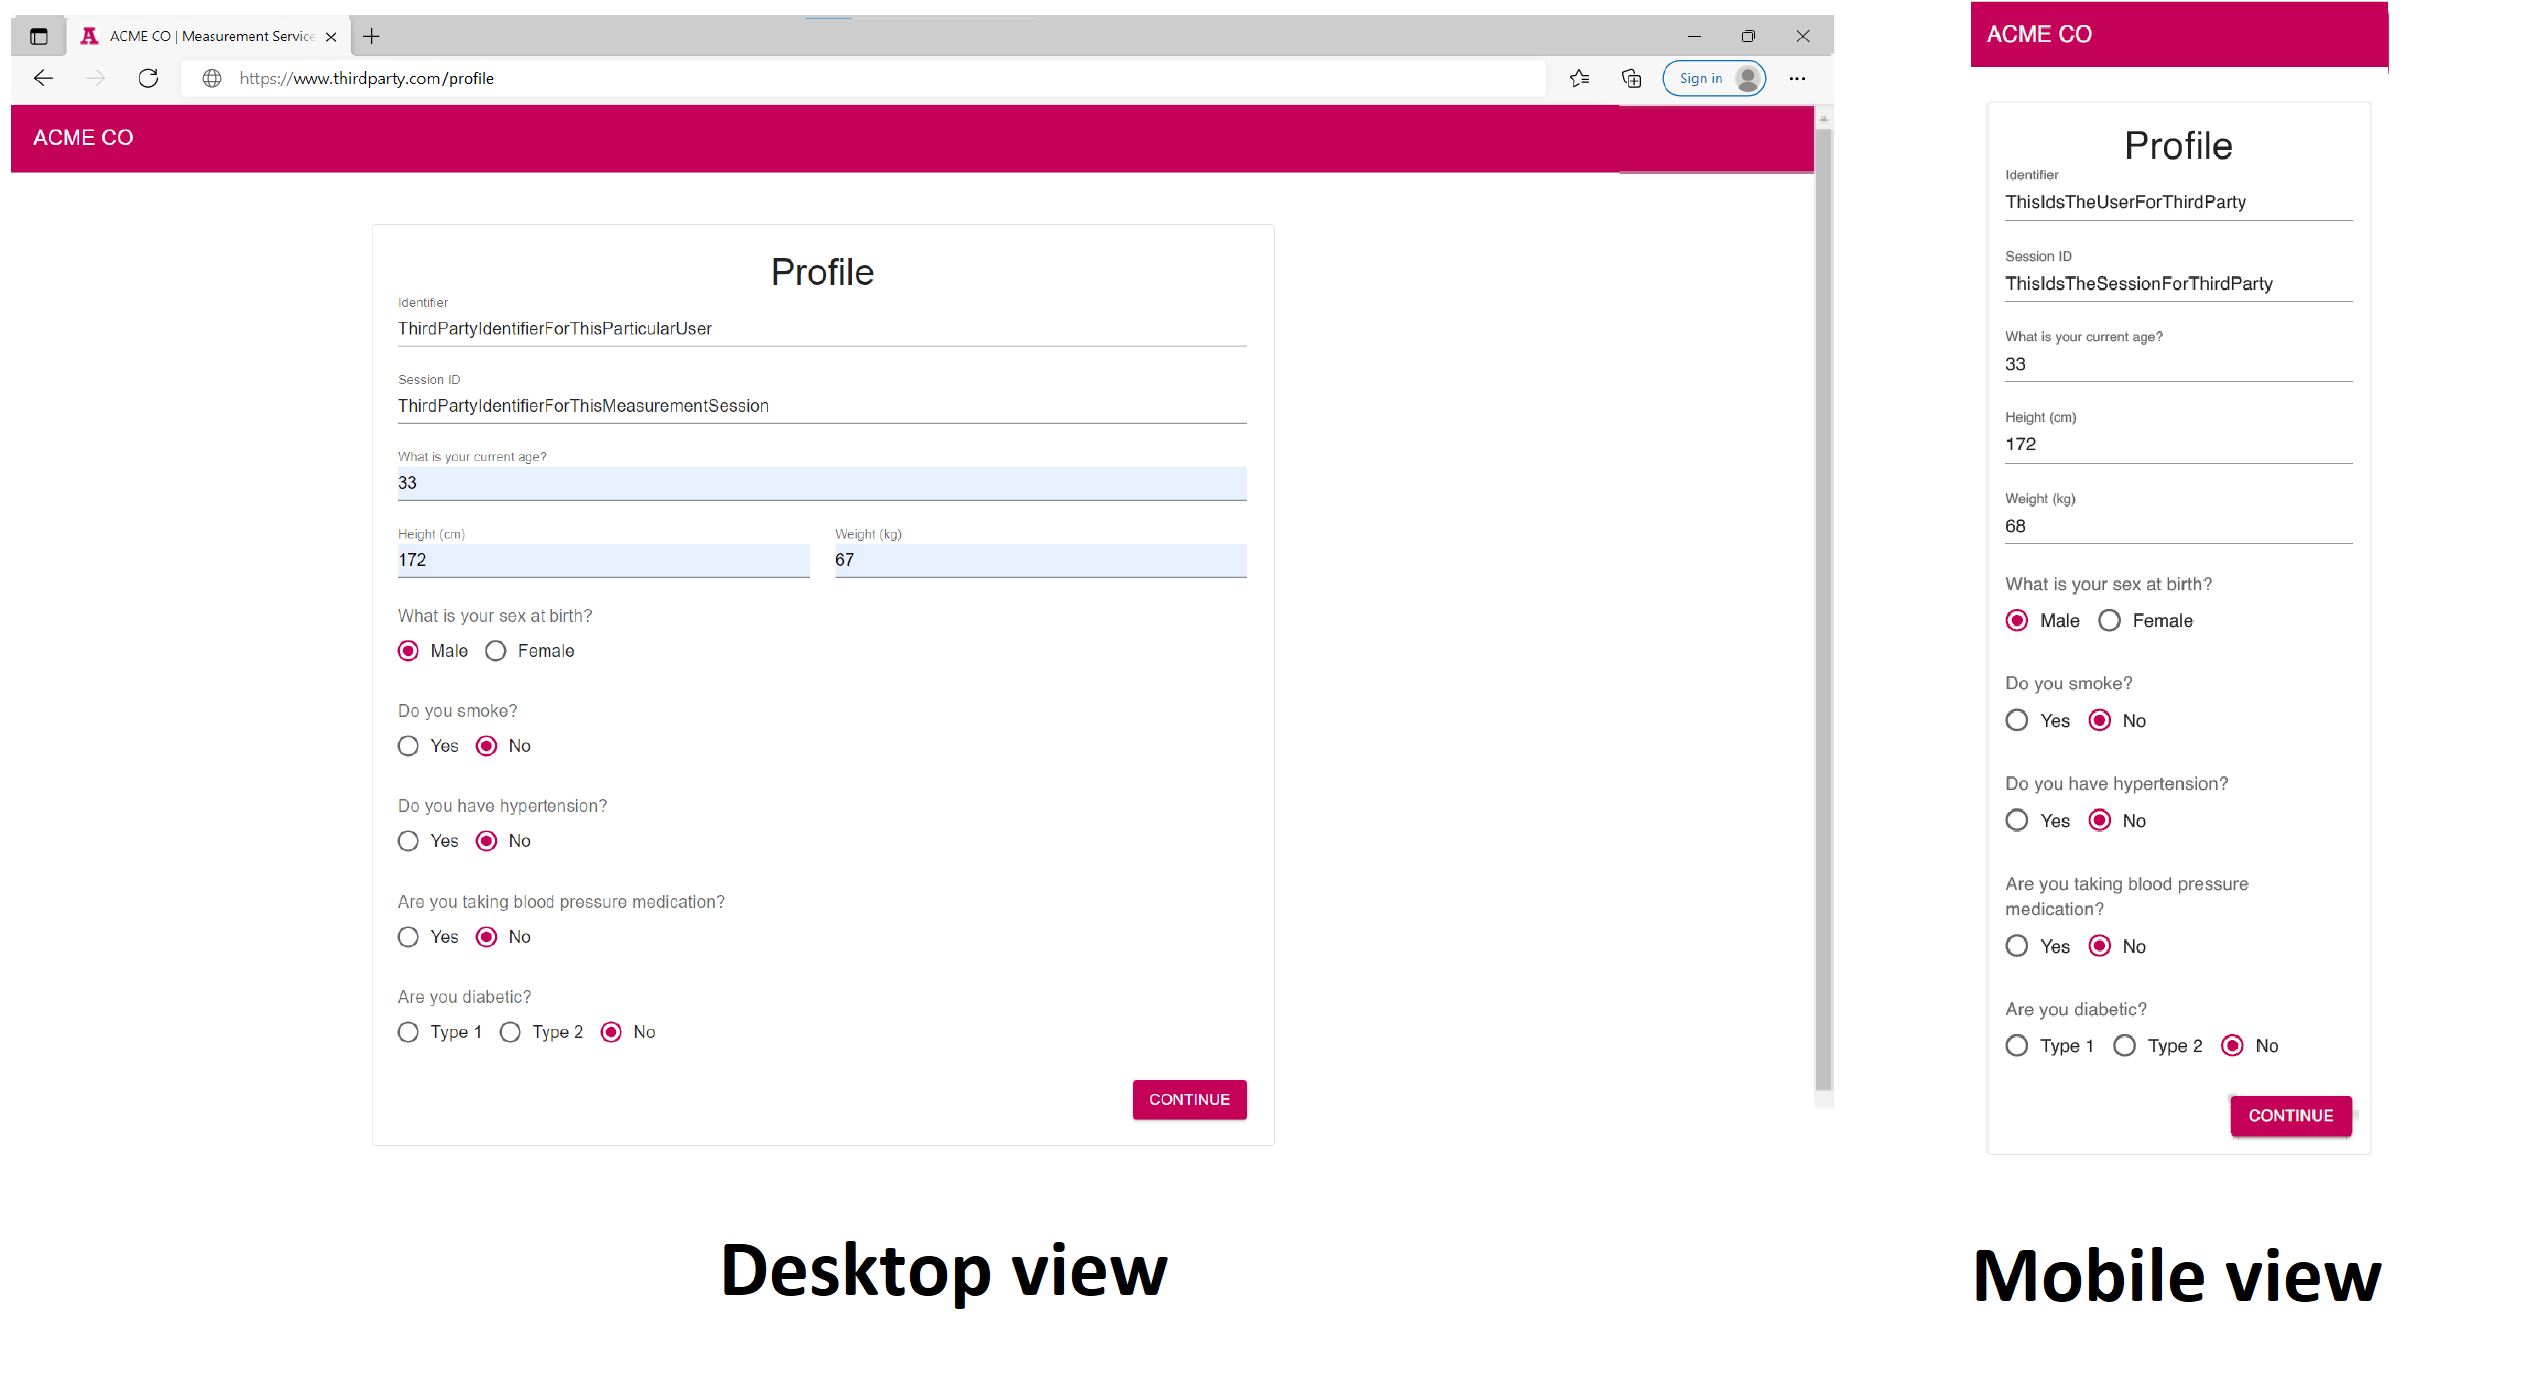
1. User profile information at third party website
The user visits the third-party website with a single-page application. Let’s assume it is www.thirdparty.com.
WMS needs user profile information to carry out measurements. Third party website can provide this data as per their preference. They may ask the user to enter the information through a profile entry form, or they may already be having this data stored with them, or they may adopt any other method of obtaining this information.
An example of first option when user is asked to enter the profile information is shown in the image below.
(Click here to open a larger version of this diagram in a new window)
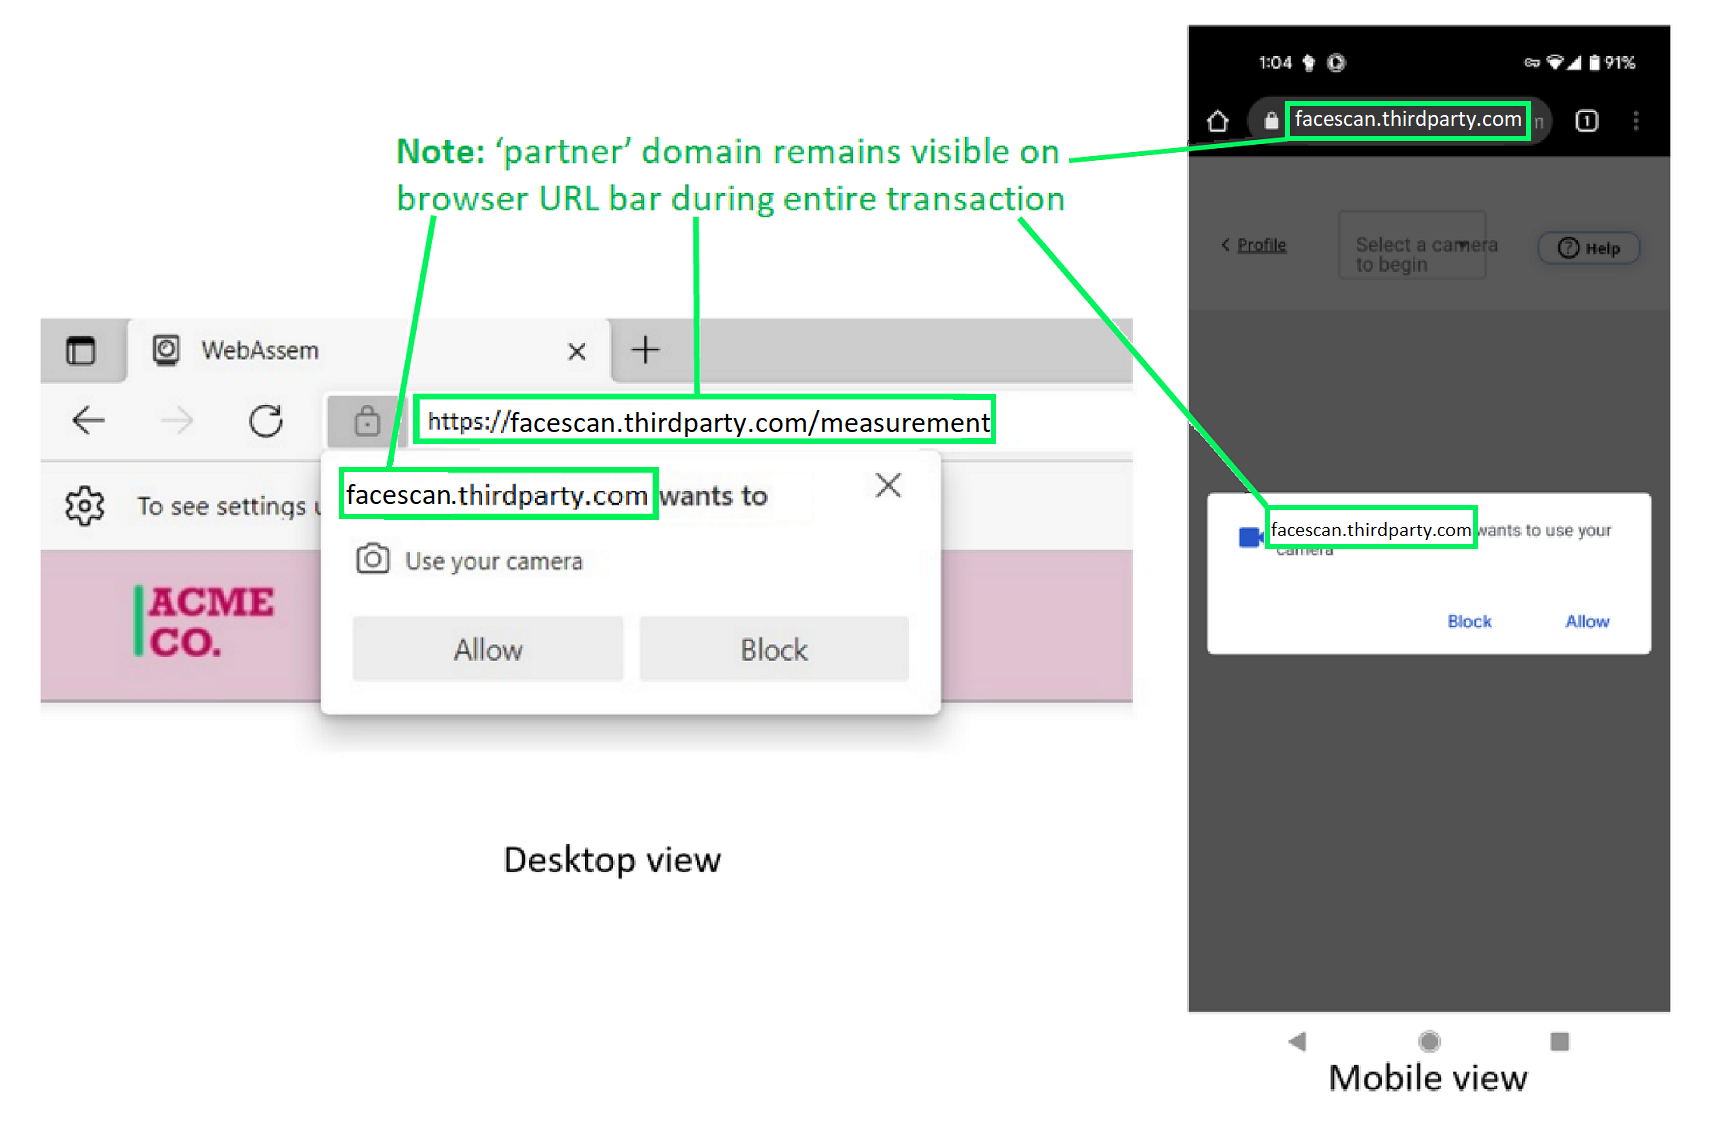
2. User is redirected and asked for permission to access the camera
On submitting the profile information, the user is redirected to WMS hosted at nuralogix.ai via a third-party subdomain (using CNAME). The URL in the browser remains the same for the user as that of third-party website i.e. "thirdparty.com" in this example.
On next screen, the browser asks the user to allow access to use camera.
(Click here to open a larger version of this diagram in a new window)
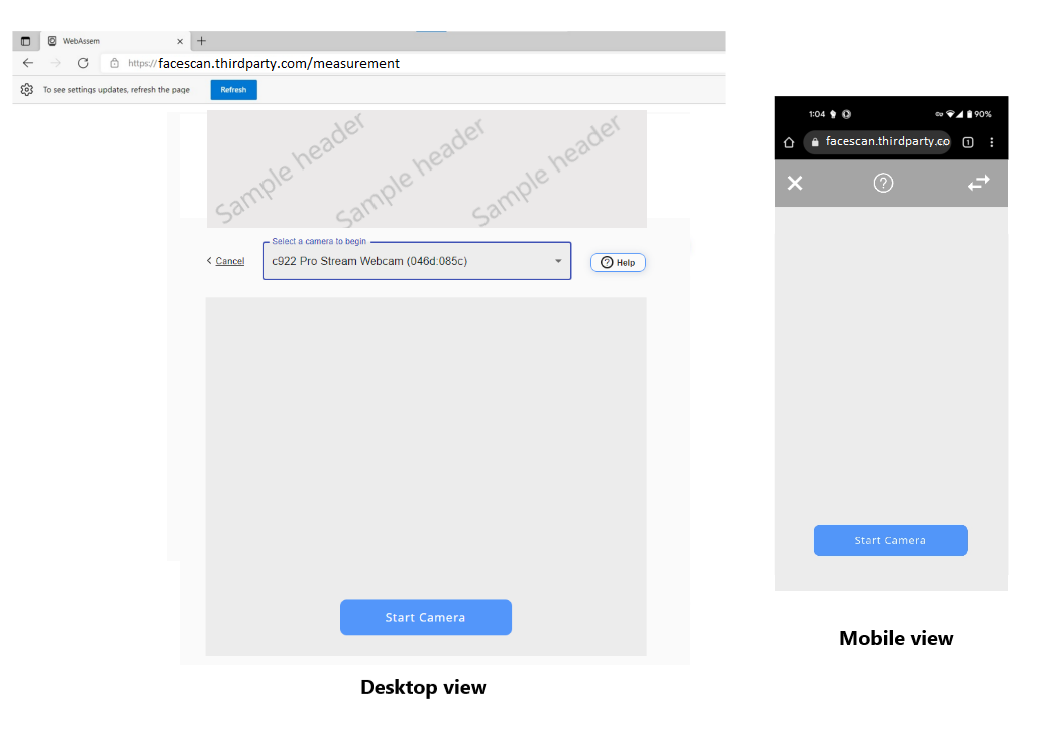
3. User selects and starts the camera
The user is presented with a list available cameras on his device and can select any one of them.
The user then starts the selected camera.
(Click here to open a larger version of this diagram in a new window)
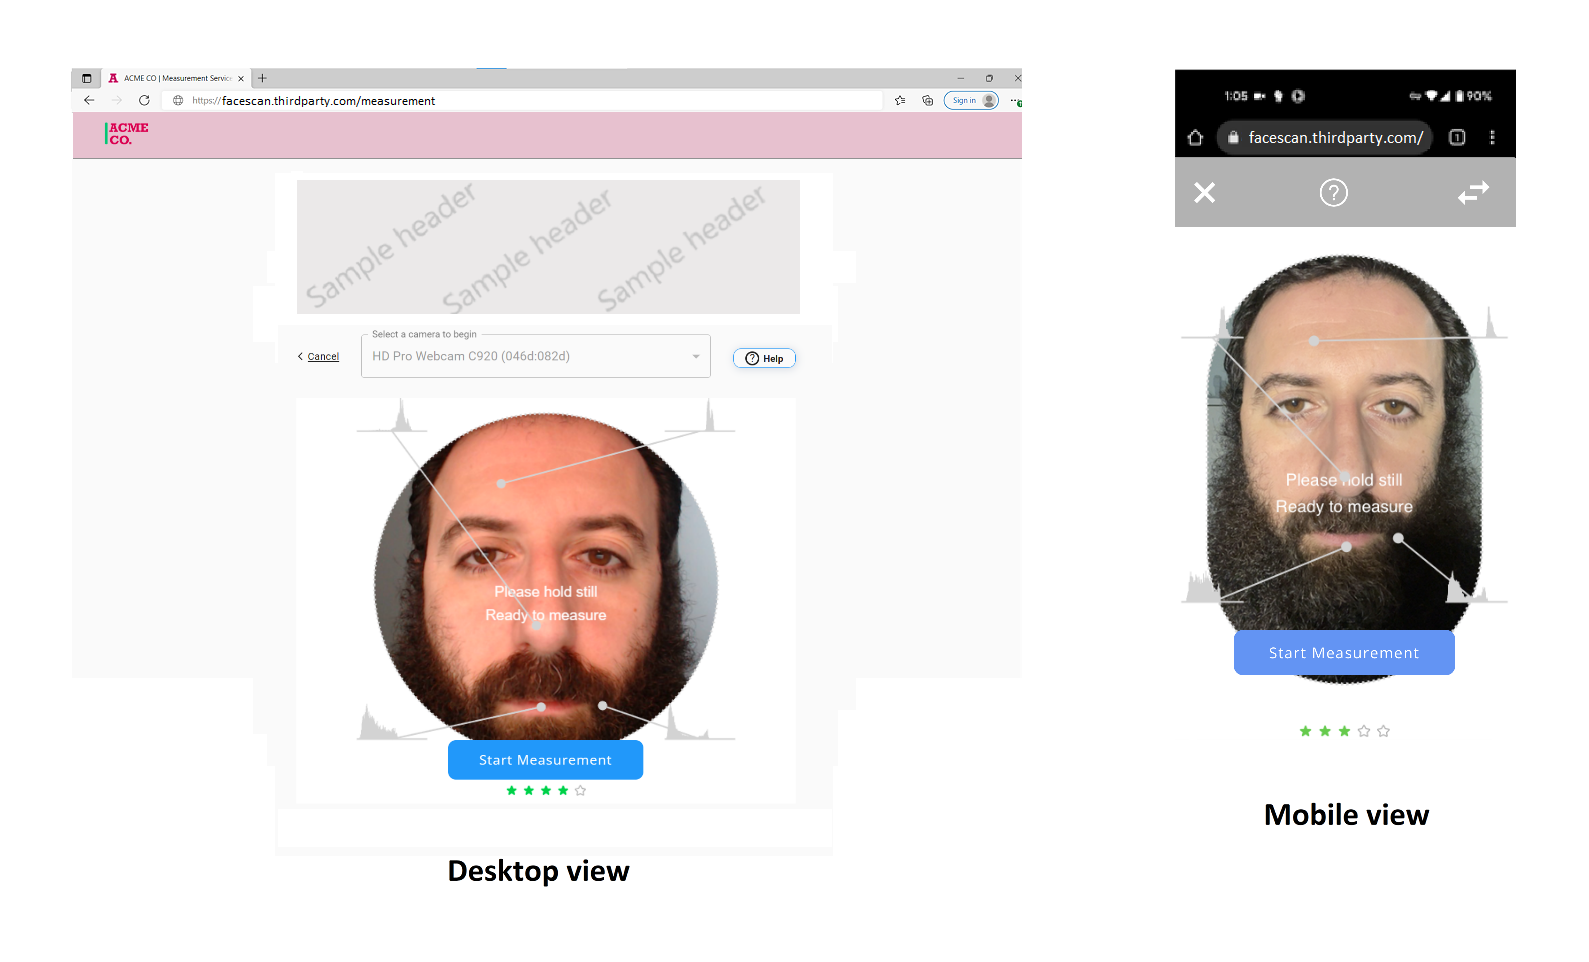
4. Measurement is ready to start
The user is presented with a view from his selected camera. To guide the user for a proper measurement, a white circle appears on the screen. The user is required to keep his face within that circle.
Face tracking begins and a certain number of points on the face are highlighted with histograms.
Stars at the bottom of the screen represent the quality of the current optical conditions. The higher the star rating, the more likely the measurement will complete successfully.
(Click here to open a larger version of this diagram in a new window)
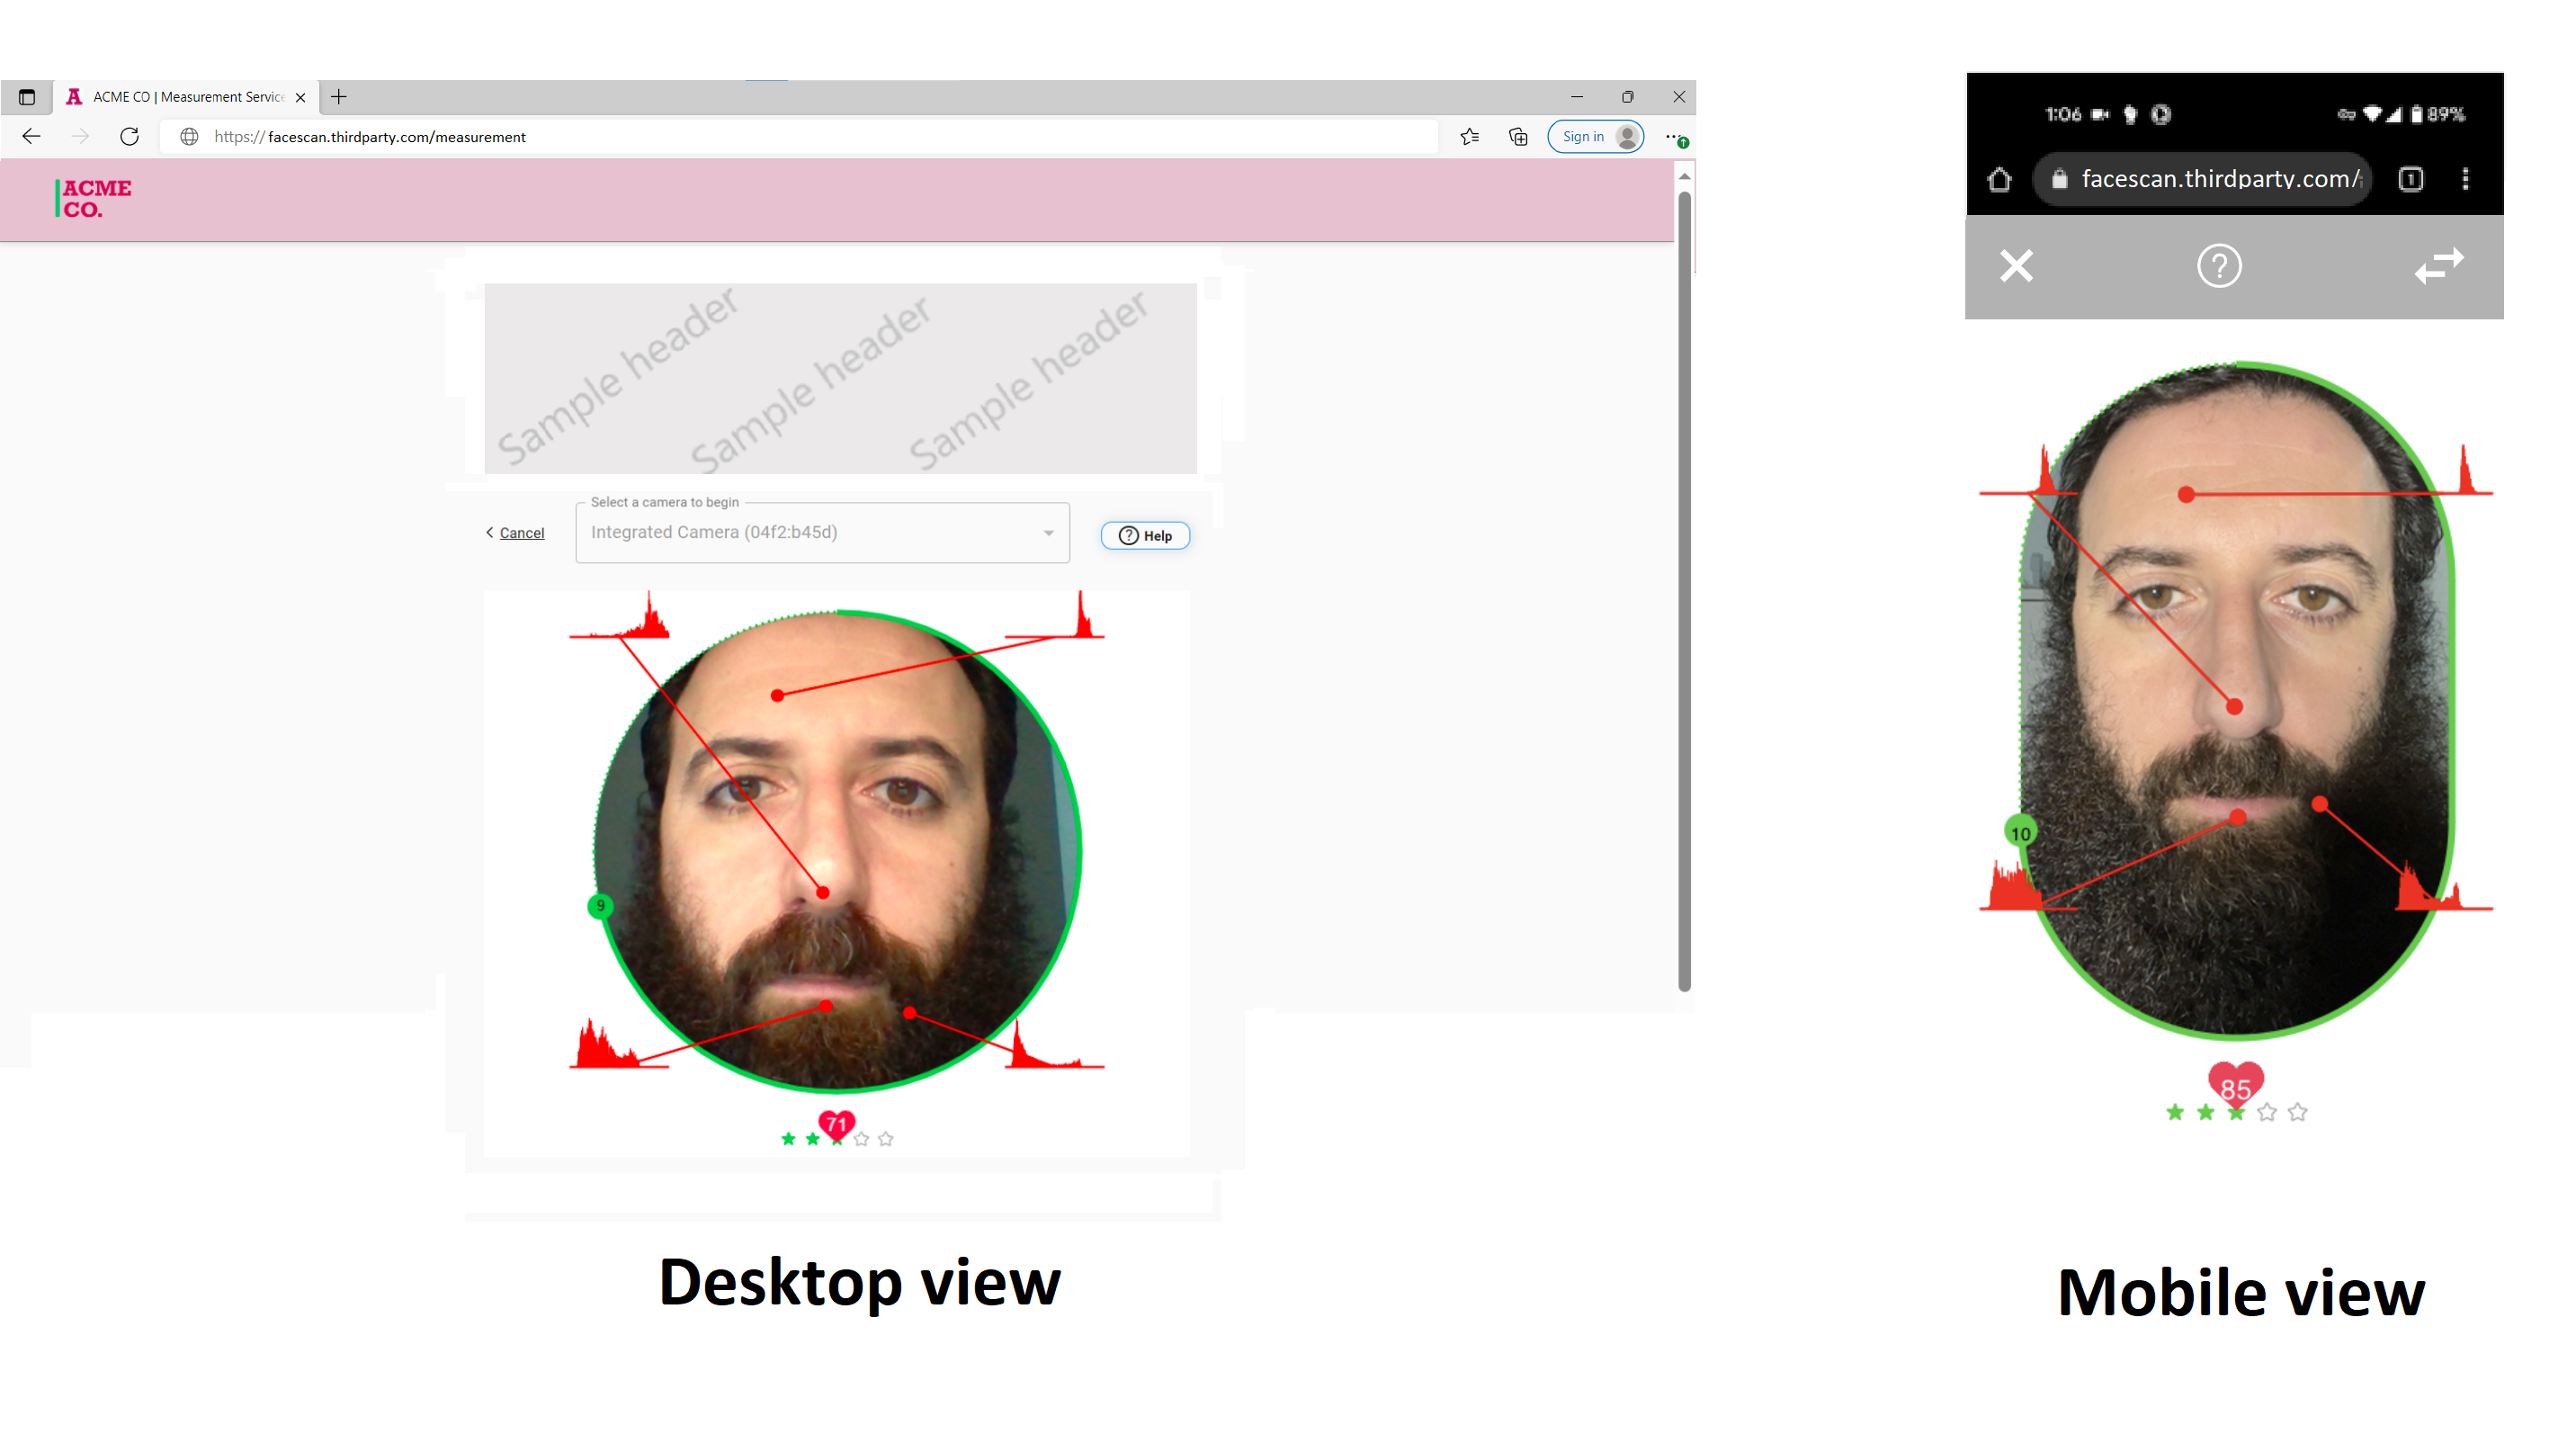
5. Measurement progress
The measurement starts and the user is shown progress through a 30 second timer on the screen.
The histograms turn red when the quality of data captured is above a certain threshold.
A red heart with a number appears at the bottom of the screen. This number represents an intermediate heart rate.
(Click here to open a larger version of this diagram in a new window)
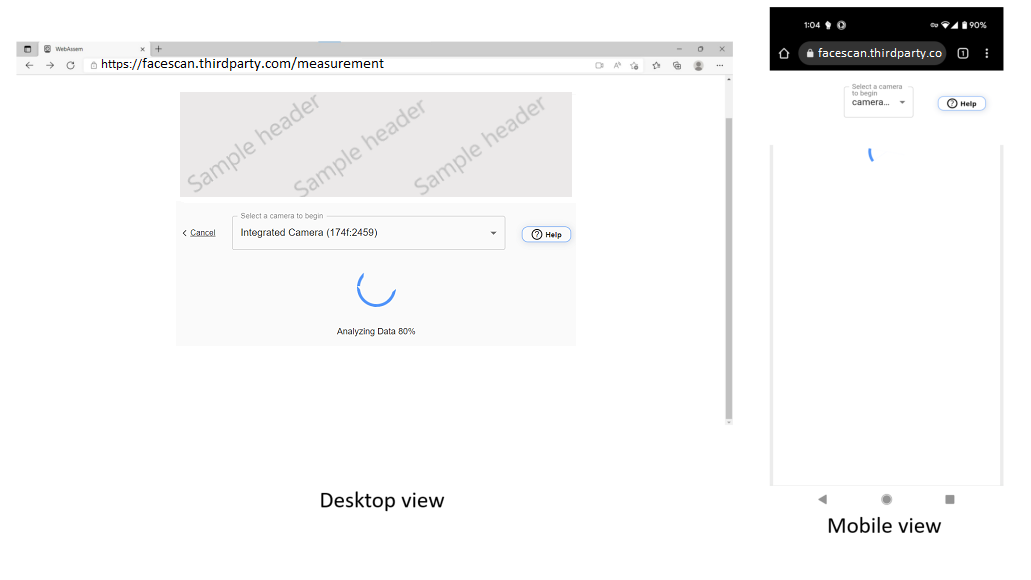
6. Waiting for measurement results
The user is presented with a circular progress bar while waiting for the measurement to be processed.
The user is redirected back to the original third-party domain after DeepAffex has processed data and sent results
(Click here to open a larger version of this diagram in a new window)
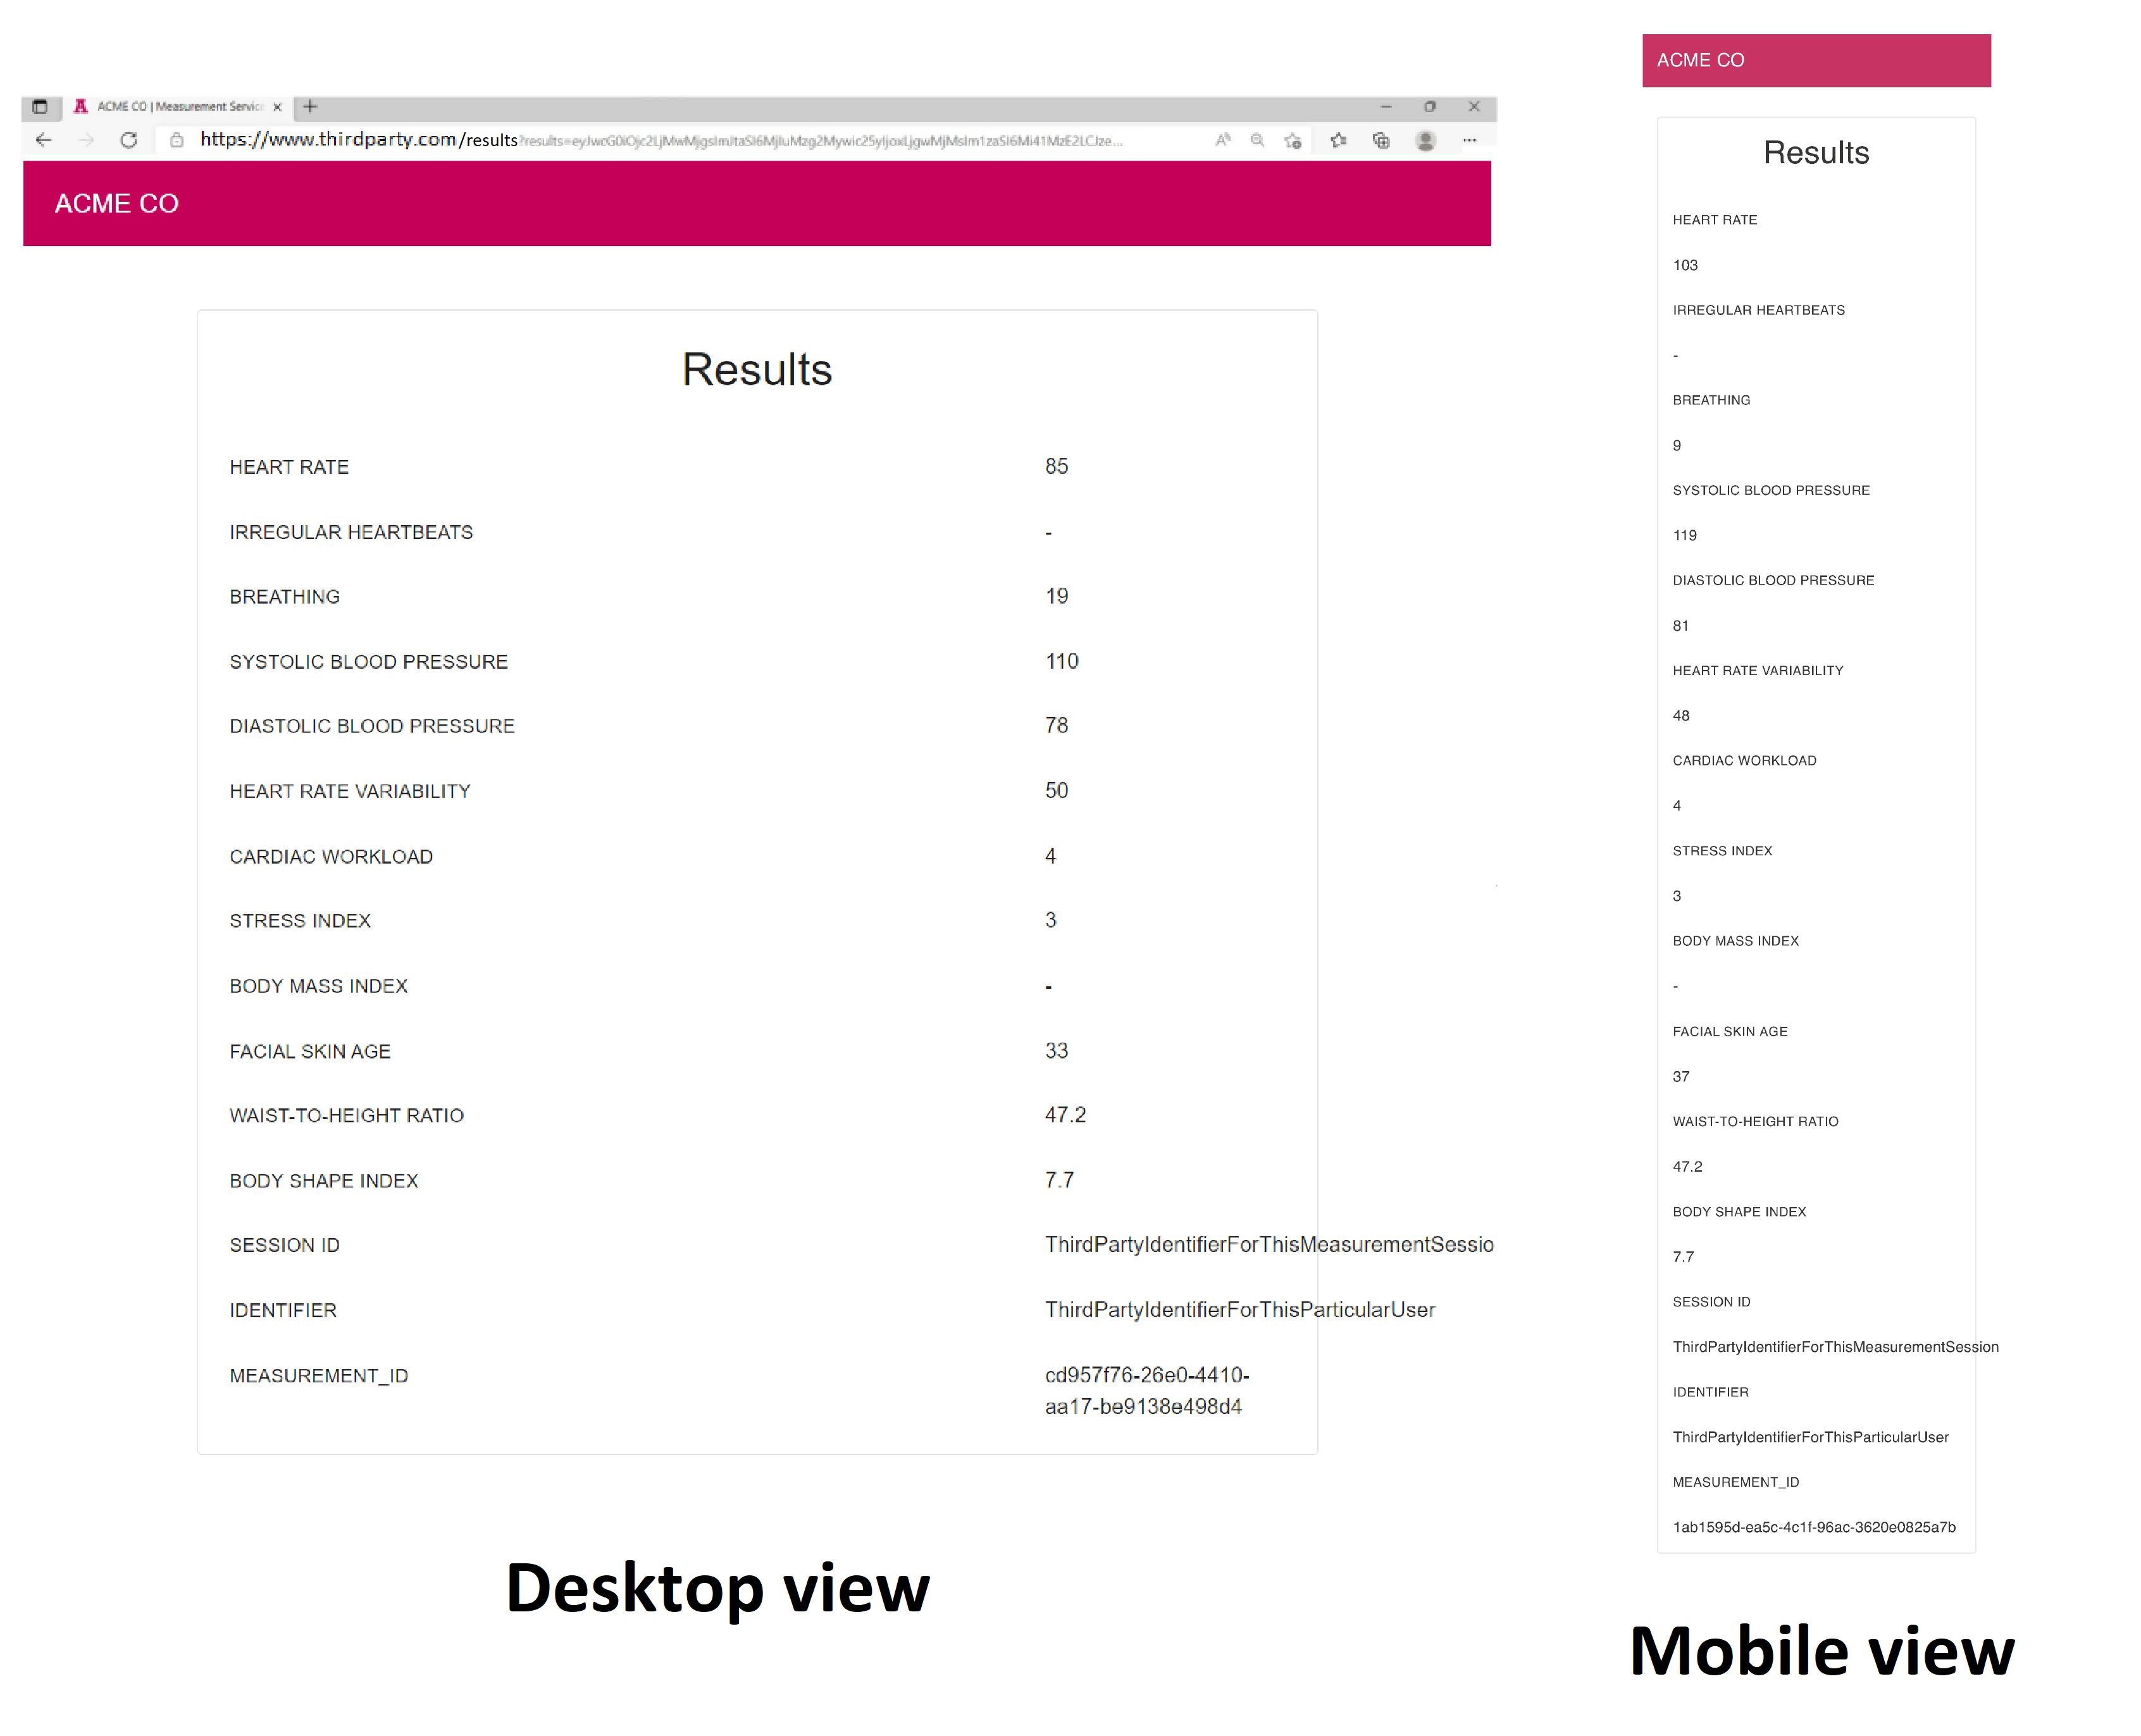
7. Results for the user measurement are available
User is then redirected back to the third-party website once DeepAffex has completed processing the measurement results.
Partner web application is responsible for all admin/display/storage of end-user measurement results. They may use the results as per their choice of implementation.
An example of implementation when measurement results are presented to the user at third-party website is shown in the image below.
(Click here to open a larger version of this diagram in a new window)